Oenoview premium
Segment your vineyard according to the qualitative potential of the plots thanks to Oenoview.

Your tailormade vineyard
Prepare your harvest
Oenoview accompanies you in the preparation of your harvest, according to the real and changing state of each of your parcels.
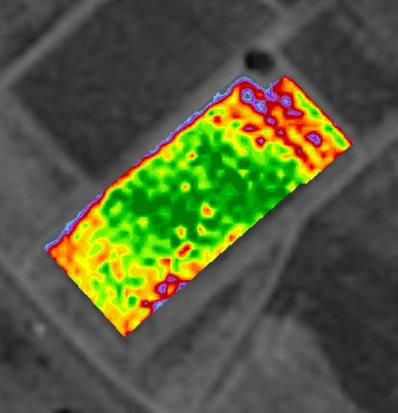
Map your vineyard, visualize the heterogeneities
A precise and reliable mapping of the vigor of your plots at ripening to visualize in details intra parcellar heterogeneities.
Segment your vineyard, define batches
A batching option to help you define batches of plots according to your production goals.
A top notch technology at the heart of your vineyard
A satelite image with a spatial resolution of 1.5m acquired at ripening stage allows an estimation of the vigor of your plots thanks to the calculation of a biophysical parameter, the fCover (fraction of ground covered by green vegetation). This parameter quantifies the surface of green vegetation observed directly below one square metter of ground. It is considered as more robust than the NDVI. It is the result of a specific modelization of the vine vegetation with a model developed by Airbus for more than ten years.
The OENOVIEW product bas initially been developed by Airbus Defence and Space’s Geo-Intelligence line program and contains an original technology.
Our viticulture services are developed and marketed with our partner ICV, specialized in viticulture/oenology consulting.
Personalized formats adapted to your use
Mobile application
A mobile application, allowing you to access your maps live from the field and mark your geolocalized comments, with or without signal.
Zone maps
Zone maps to localize maturity controls and segment your vineyard.
Statistics files
An Excel file with all the statistics to plan your harvest.
Georeferenced maps
Georeferenced maps allowing you to understand the heterogeneity of your plots.

At the office
Vigor maps with various levels of details – with pixels and with zones – for each plot with indicators of vigor and heterogeneity, a kmz file of all the plots treated in order to visualize the entire vineyard with Google Earth, a statistics file with an Excel format to analyze and filter the information.
In the field
The mobile application Terraview usable without signal, to visualize the maps of the vigor -with pixels and with zones – and to mark geolocalized comments, files with a SIG format compatible with a GPS system. The maps of the vigor for each plot are also provided in PDF.

